

What did your neighborhood have to say on the NYC Speaks survey?
We have created this handy tool — the NYC Speaks Data Dashboard — to help you find out the NYC Speaks survey results in your neighborhood, and engage in data-informed discussions with your community.
Click on one of the buttons below to explore the interactive NYC Speaks dashboards.
NYC Speaks is designed to translate the ideas of communities and advocates into meaningful policy. We believe a new form of government is possible when leaders engage people and empower residents.
This survey was designed for New Yorkers, by New Yorkers. Developed in deep partnership with our 80+ member Civic Policy Council, and informed by the expertise of our philanthropic partners and review of the new administration’s stated priorities, we included 27 high-impact policy questions. We asked for your input across 10 issue areas: health & well-being, arts & culture, housing & neighborhoods, economy & workforce, racial equity, climate & infrastructure, education & youth development, public safety, gender justice, and civic engagement.
The goal of this survey was to amplify the voices of New Yorkers on issues that impact them most directly, especially New Yorkers typically excluded from government decision-making: Black and brown, low-income, immigrant, youth, NYCHA and disabled communities. During our survey outreach process, we targeted 33 priority neighborhoods as identified by NYC Taskforce on Racial Inclusion & Equity (TRIE). These communities were the hardest hit by COVID-19, and have a high percentage of health and socioeconomic disparities.
The survey received responses in all eleven languages available and across every residential zip code in the city.
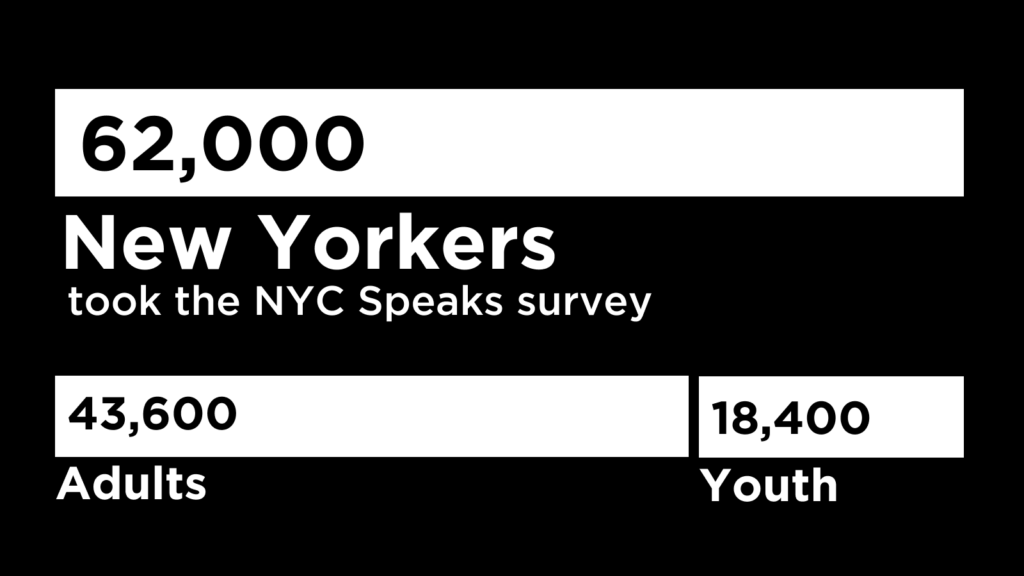
Who took the NYC Speaks survey?
Zip Code Map
The map below shows the total responses received from each NYC ZIP code. Click on any of the ZIP codes on the map to view the number of responses received from there. Click and drag your pointer to pan across the map. Use the zoom control with "+" and "-" buttons on the top right corner of the map to zoom in and out, respectively. Use the home button to return to the default extent. Click on the double arrow above the zoom control to view the map's legend.